
Parcel Spend Analytics
Shipium’s parcel spend intelligence software captures every carrier charge across your network, normalizes it into one dataset, and shows finance and operations where the money goes.
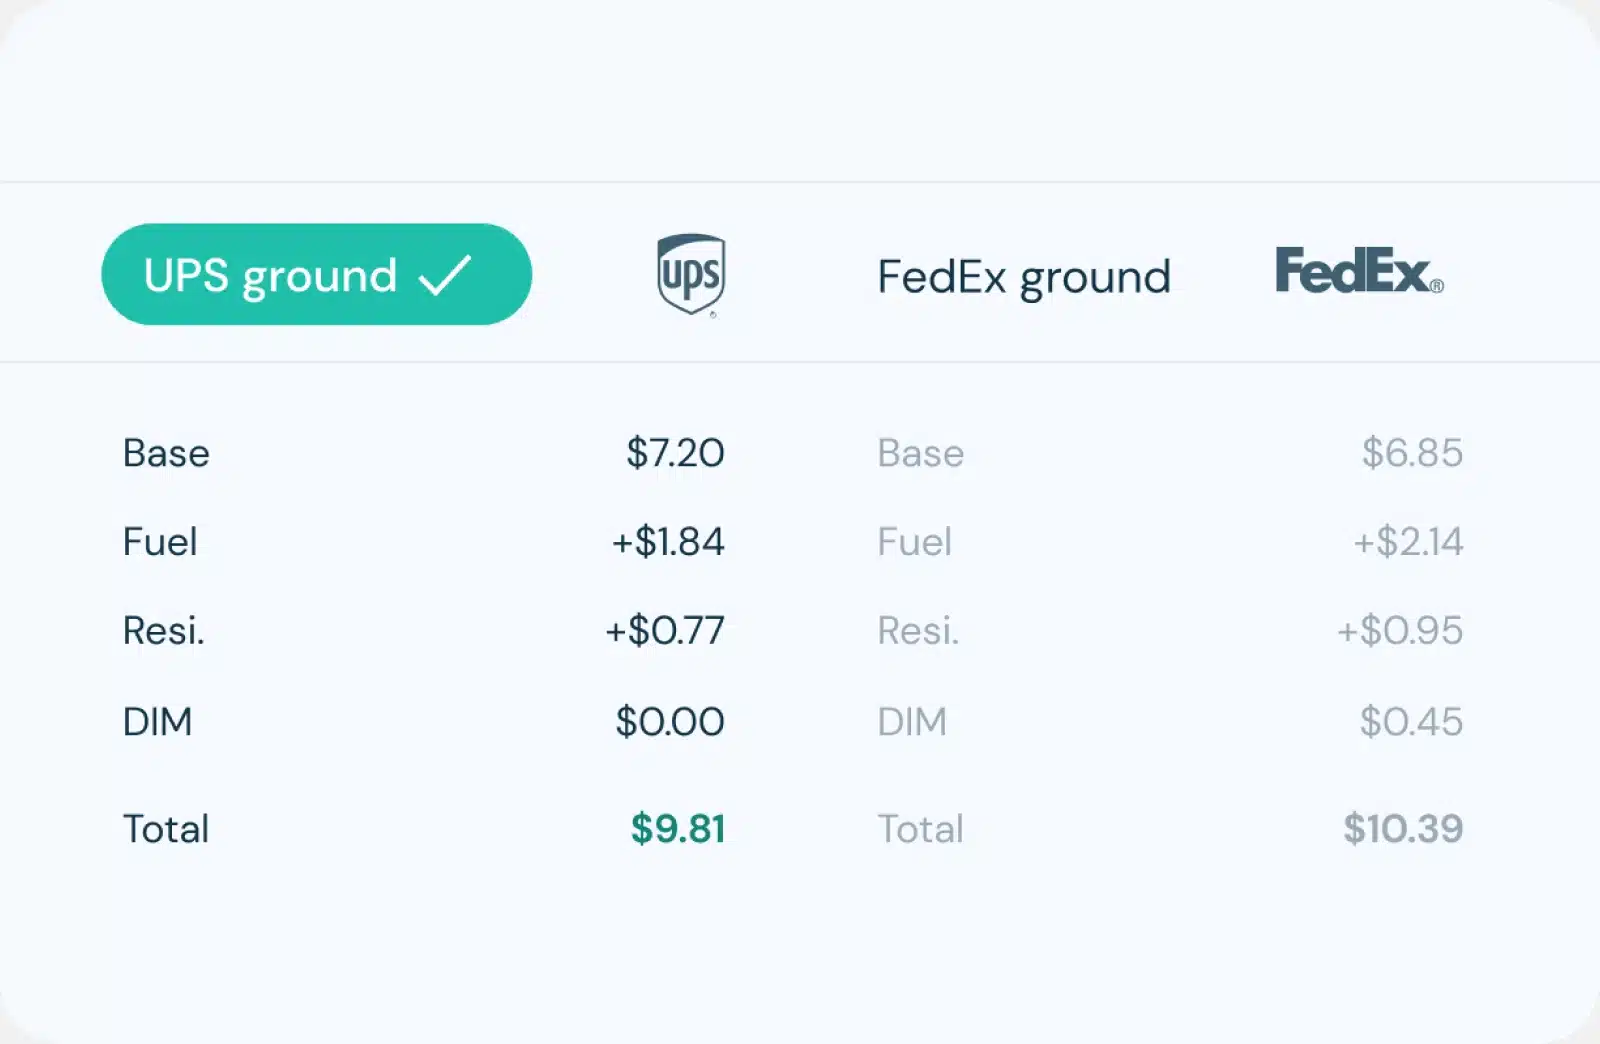
Know what every parcel costs
Parcel business intelligence starts with clean data. Shipium turns the charges buried in provider files and portals into a single, queryable record of what your network actually costs.
Multi-carrier spend normalization
Every transportation partner reports rates, surcharges, weights, and service names its own way. Shipium maps each field into a single billing record per shipment, giving analysts one data set to query for price per package, lane, or account.

Cost driver analysis
Shipium isolates what moves your parcel bill, from surcharge increases on residential deliveries to lanes drifting toward a pricier carrier, and ranks each factor by cost impact.

Automated dashboards and reports
Pre-built dashboards track cost per parcel, surcharges as a share of total spend, and the gap between quoted and billed amounts, broken down by carrier, lane, and account. Finance, procurement, and operations each build their own reports from the same shipment data.

Parcel spend forecasting
Your team can see how an upcoming general rate increase, a carrier switch, or a shift in volume will change parcel costs before it takes effect.

Parcel spend intelligence for enterprise shippers

Cut parcel spend with data your whole team trusts
Shipium gives every team the same view of parcel spend, drawn from the data the platform records at execution.
Faster cost insights
Shipium reports cost per package by carrier, origin, and service after delivery. When parcel costs rise, your team can see which factors drove the increase and act on them.
Lower carrier rates
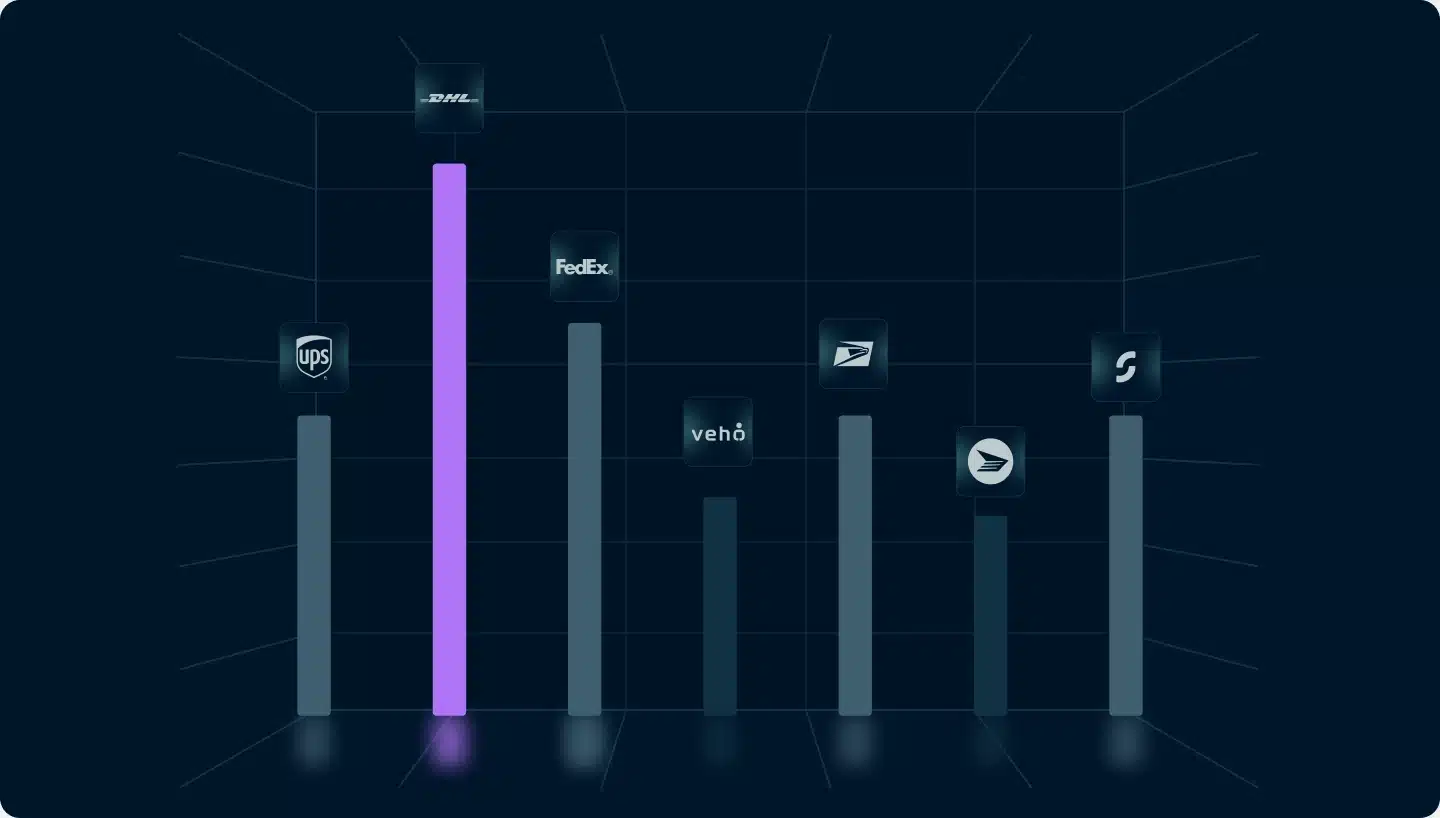
Shipium compares what each carrier charges per parcel by zone, weight, and service, and shows where one carrier costs more than the others for the same shipment. You can then ship each parcel with the lowest-cost carrier that still meets the delivery date.
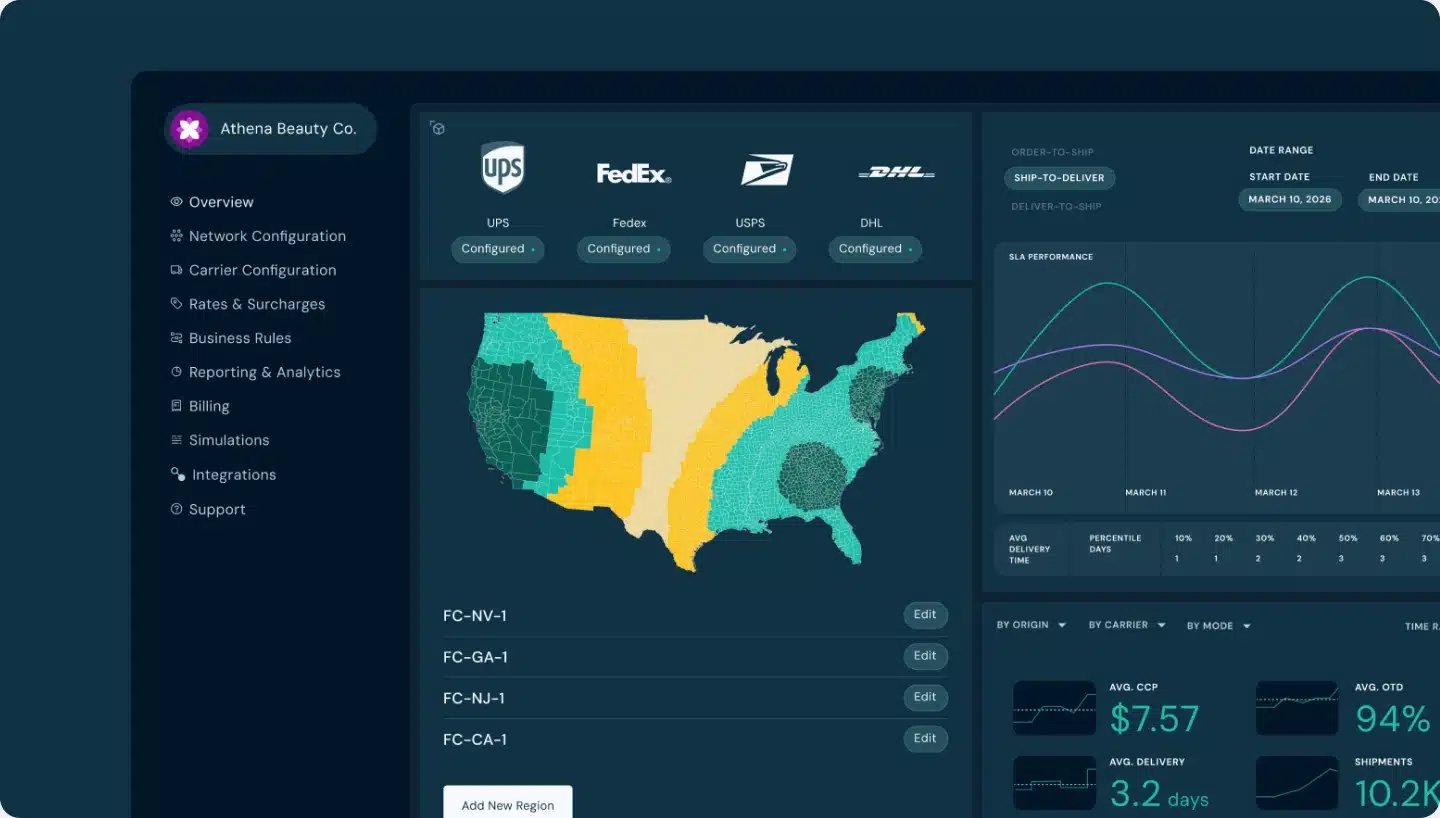
Improved margins
Shipium compares fees per shipment, delivery speed, and service mix. An underperforming lane surfaces before it pulls down your network average, giving you room to redirect volume or renegotiate before margin erodes.
Aligned teams
Finance, procurement, and operations pull pricing numbers from the same underlying data set. A cost question gets one answer in the meeting instead of a follow-up to reconcile three spreadsheets.
Frequently asked questions
What is parcel spend analytics, and how is it different from general shipping analytics?
Parcel spend analytics is the practice of separating every parcel charge into its parts (base rate, surcharges, accessorials, and adjustments) and tracking how each charge changes over time. General shipping analytics reports on how the network performed. Here’s a breakdown:
- Performance analytics tracks shipping KPIs such as on-time delivery and days in transit.
- Spend analytics tracks cost per package, surcharges as a share of total spend, and the gap between the rate quoted before shipping and the amount a carrier billed.
Shipium tracks delivery performance and parcel spend from the same data the platform records when it rates and labels each parcel. A rise in cost per package can be read next to the service that caused it, so you can fix the specific cause instead of only seeing a higher total on the invoice.
What's the best way to get full visibility into our parcel shipping spend and catch carrier billing errors?
The best way to get full visibility into parcel shipping spend and catch carrier billing errors is to compare every charge against a known expected cost, then track the difference as a metric your team reviews every week.
What usually limits parcel spend visibility:
- Fees split across carrier portals and invoice formats, so no one sees total spend by lane or account.
- Surcharges reported as one lump sum, which hides which accessorial is growing.
- No expected cost to compare against, so an overcharge looks like normal spend.
Shipium Rating Engine calculates what each shipment should cost before it ships, including your contracted discounts, surcharges, and accessorials. When the invoice arrives, Shipium validates every line against that expected cost and flags any discrepancy, so your team catches billing errors as they happen.
How do you audit carrier invoices to catch billing errors and misapplied surcharges?
You audit carrier invoices by checking each billed line against what the shipment should have cost, then reviewing the flagged lines as a group to find the error behind them.
A line-level check catches a single overcharge. To see why the same error keeps happening, group the flagged lines by:
- Carrier: The provider that misapplies your terms most often.
- Error type: Rate mistakes, missed discounts, wrong zones, inflated dimensional weights, and misapplied accessorials.
- Lane or origin: The setup behind a recurring error.
Shipium Always-On Audit runs the line-level check on every invoice. With parcel spend analytics, you see which errors repeat and what they cost each month, so your team can fix the root cause and stop the same issue from returning on future invoices.
Who uses parcel business intelligence inside an enterprise?
Parcel business intelligence is used by accounting, purchasing, logistics, and executive leadership, reading the same spend data through a different lens:
- Accounting draws a defensible price per item and clean accruals for close, pulled straight from execution data by parcel audit software.
- Purchasing gains leverage for carrier contract management, approaching a renewal with actual spend and service history.
- Logistics gets visibility into which lanes and origins cost the most, catching an expensive routing pattern before it repeats across a full quarter, which helps reduce shipping costs.
- Executive leadership gets one trustworthy number to report against, without reconciling separate totals before a board update.
How does parcel spend intelligence support carrier contract negotiations?
Parcel spend intelligence supports carrier contract negotiations by showing, in your own data, where a carrier’s pricing costs you the most and what a proposed change would be worth.
Track these four parcel analytics metrics before a renewal:
- Cost per package by zone and weight break, to find where a provider’s rates run highest.
- Surcharges as a share of total spend, since accessorials often grow faster than base rates.
- Volume against each discount tier, to know how close you are to the next threshold.
- Expected cost increases by lane under the carrier’s next general rate increase.
With those numbers, your team can focus parcel contract negotiation on the lanes and fees with the biggest savings potential.